Admiral
Insurance
Visualizing the global reality of medical costs through high-performance data storytelling.
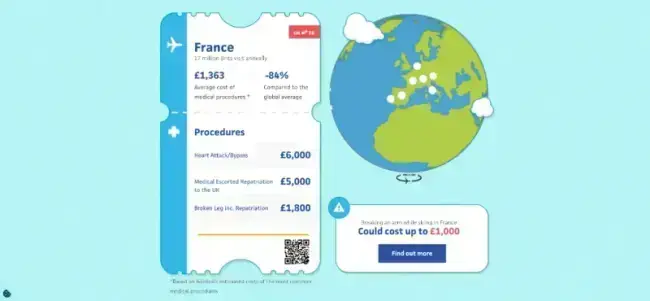
Technical Specs
Engine
Pixi.js (WebGL Rendering) for high-performance 3D visualization.
Visualization
Dynamic 3D Globe with interactive nodes and state-synced UI panels.
Architecture
Multi-layered data storytelling syncing situational narratives with granular costs.
The Challenge
Breaking the "It Won't Happen to Me" Bias.
Admiral Insurance needed a way to make the high costs of medical emergencies abroad feel real and tangible to travelers. Traditional data tables and static articles weren't engaging enough to convey the significant financial risks of traveling without insurance.
Immersive 3D Storytelling
I architected an interactive 3D globe visualization that allowed users to explore real-world medical cost data in a highly engaging environment.
- 01Used Pixi.js for silky-smooth 60fps interaction on both desktop and mobile.
- 02Implemented 'Multi-Layered' data: Narratives on click, Procedure costs on selection.
- 03Dynamic state synchronization between the 3D canvas and React-based UI panels.
- 04Crafted the "Procedures" ticket interface to make data feel like an official breakdown.
Data Layering & Impact.
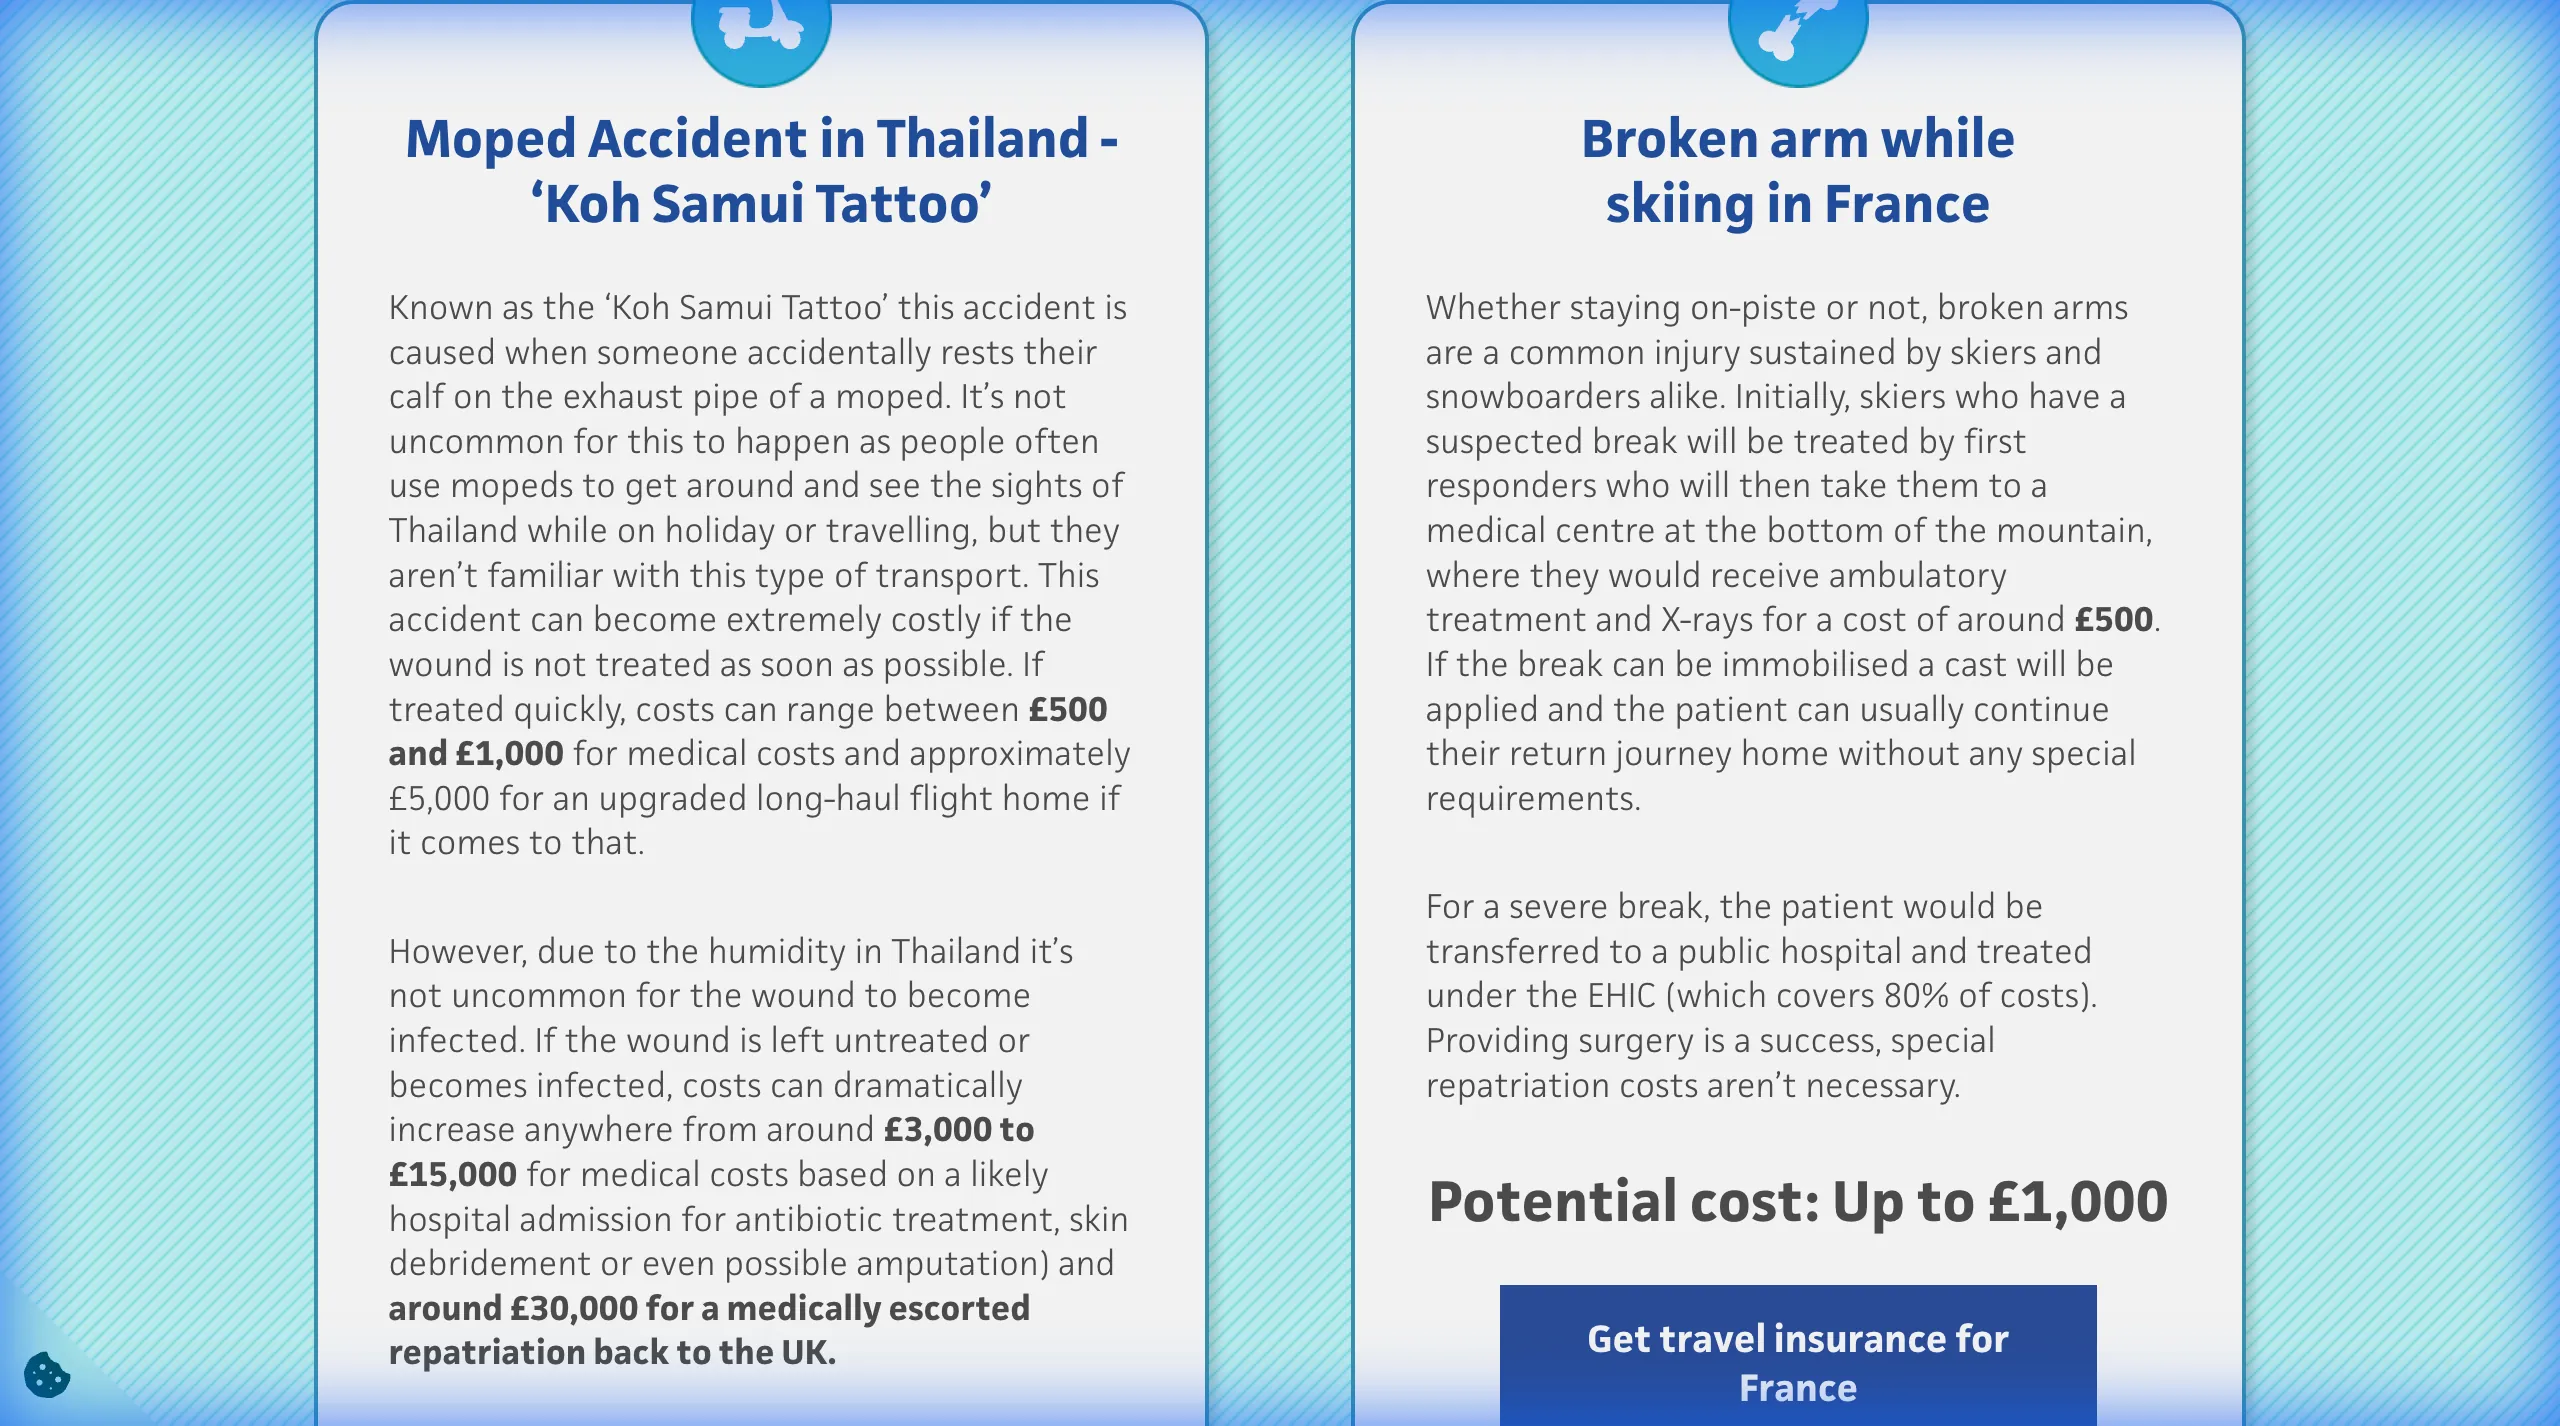
Fig 1: Dynamic UI State Sync
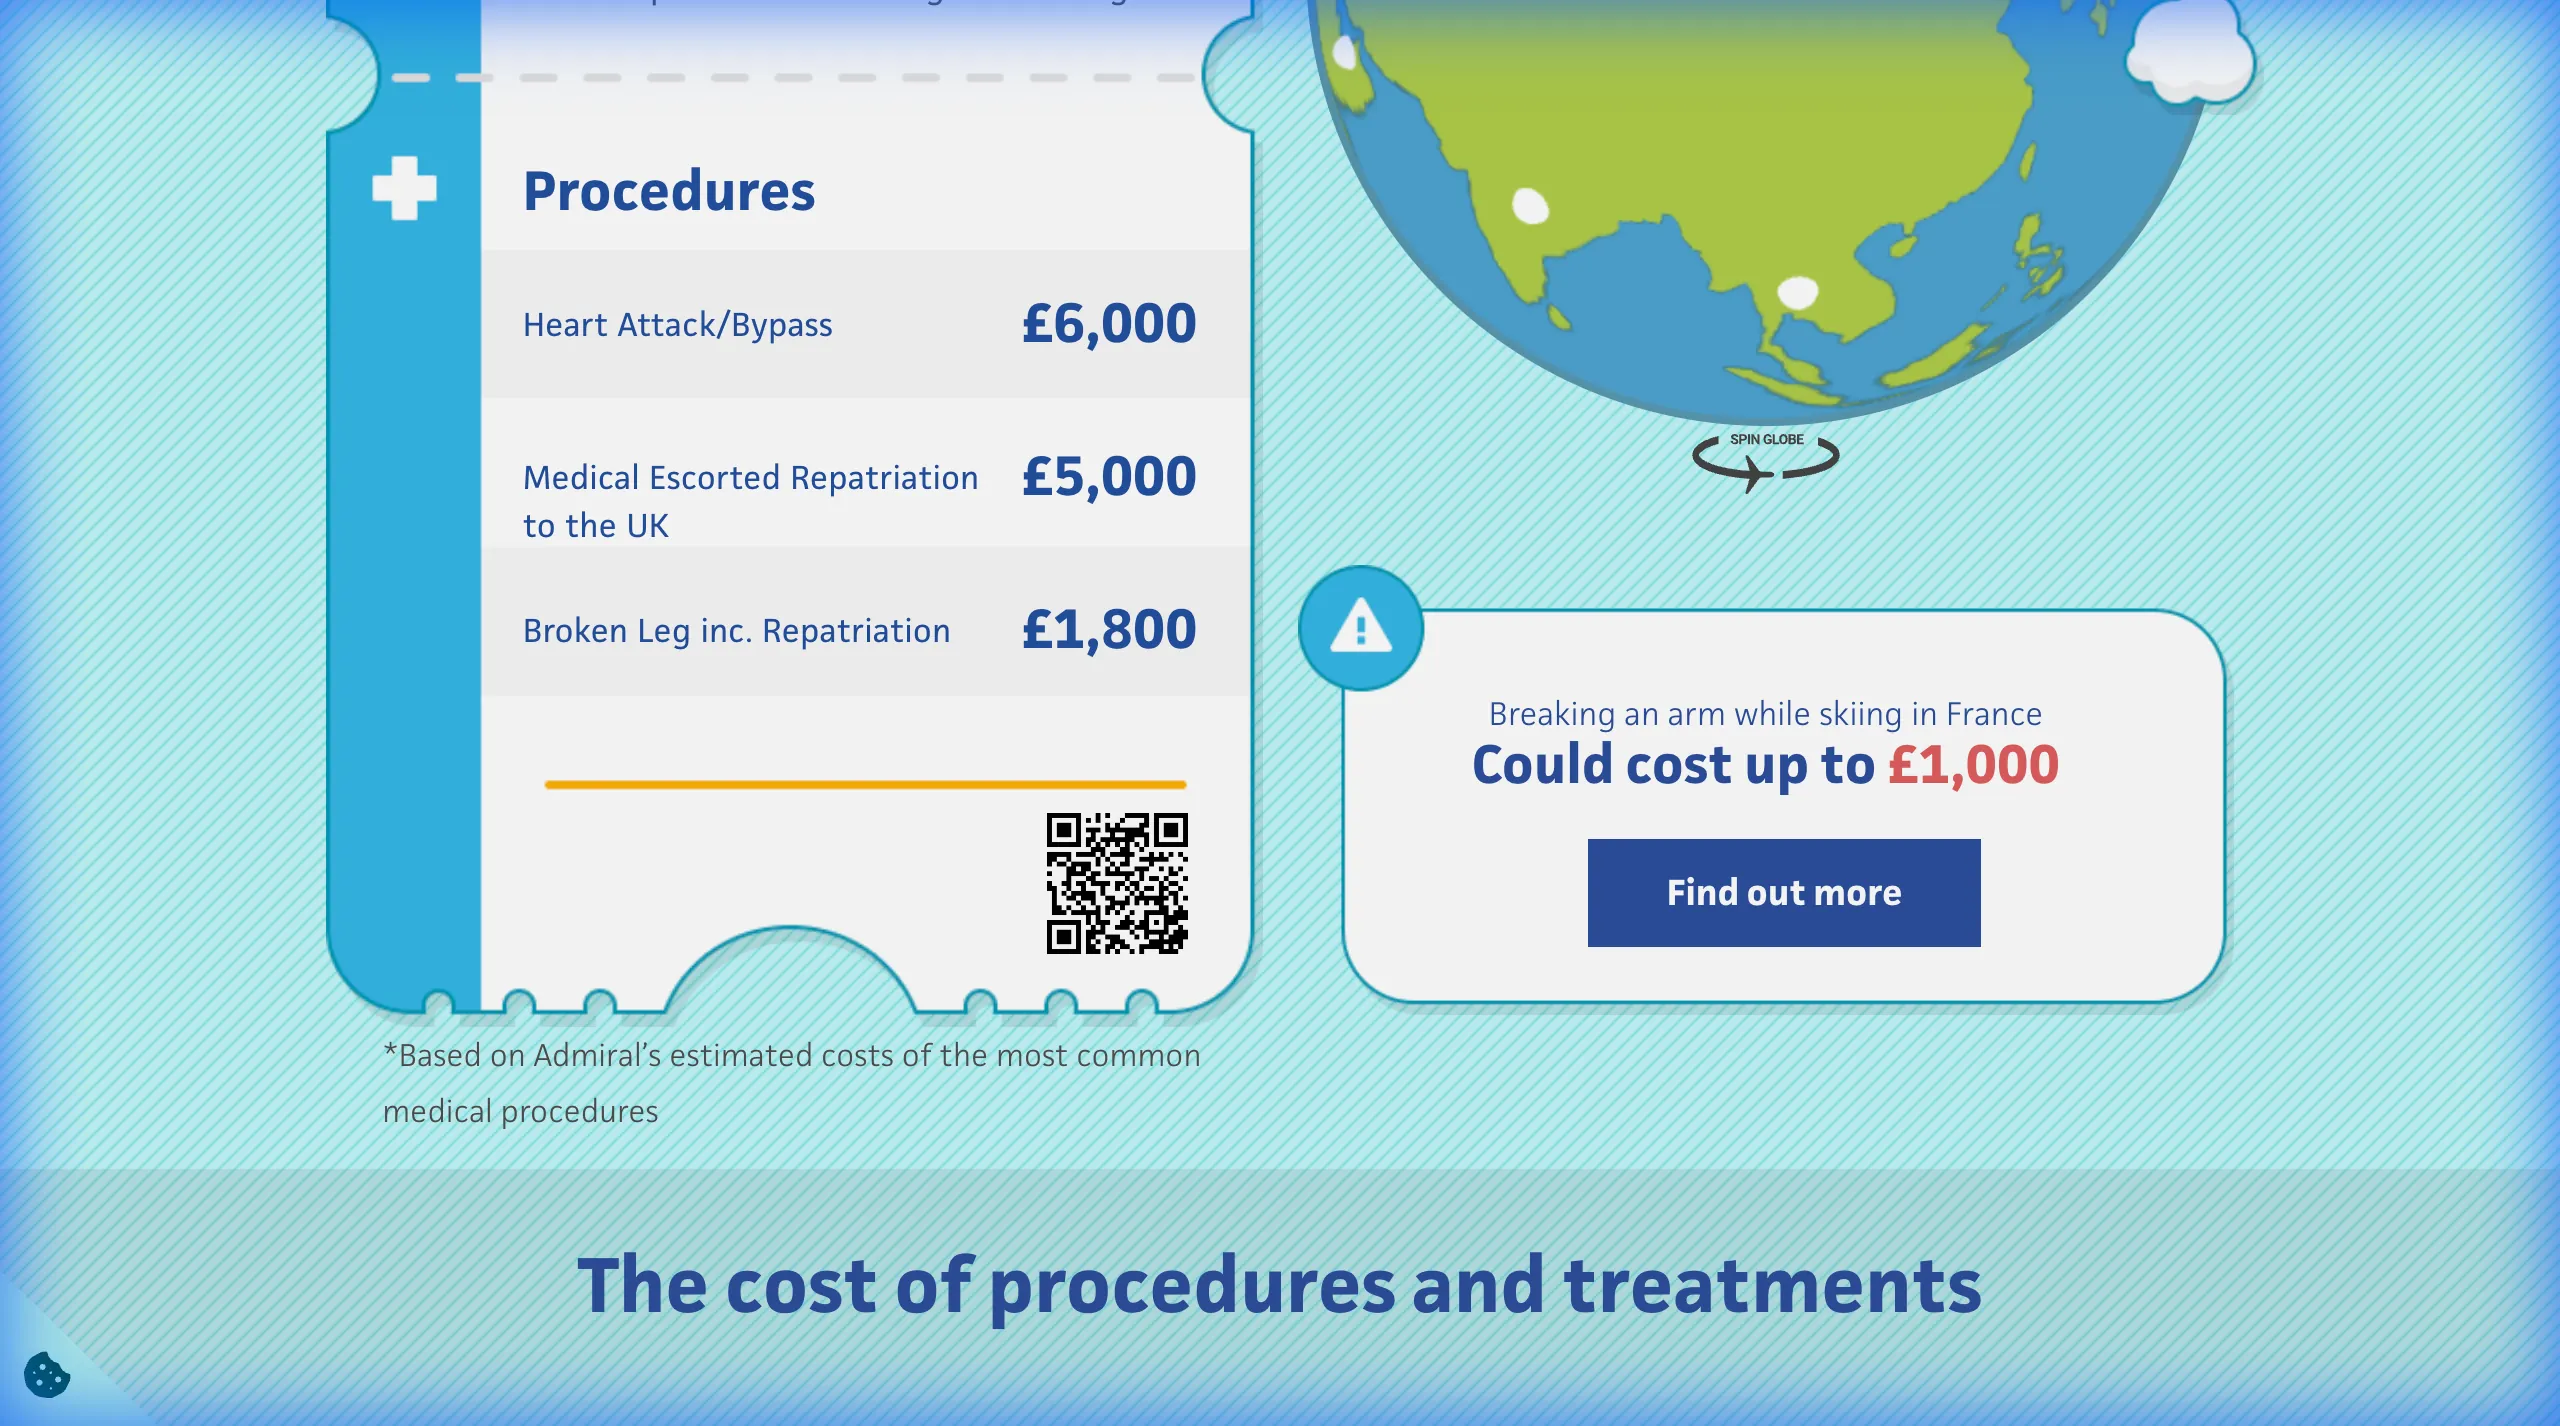
Fig 2: Situational Multi-Layer Data
The project transitioned from **Situational Narratives** (e.g., "Falling off a moped in Thailand") to **Granular Procedural Costs** (e.g., Heart Attack treatment vs. Medical Repatriation). This approach helped users realize that costs vary wildly by region—from £1,000 for a broken arm in France to £115,000 for surgery in the USA.
The Outcomes
Increased Sales Conversions
The immersive visualization directly correlated with a measurable increase in travel insurance quote requests.
Pixi.js Optimization
Achieved 60fps visual fidelity on mobile devices, ensuring the experience reached all users regardless of hardware.
User Understanding
Simplified complex multi-country data into a cohesive, interactive narrative that users actually wanted to explore.
Industry Recognition
Acknowledged for its innovative use of interactive tech in the financial service sector.